
Lesson 14 of 18
A confident answer can be wrong
Work through C207
C207’s frozen reference is Hold. JEV selected Hold at 53%, with vector [47,53,0]%. KEV selected Allow at 92.03%, with [92.03,6.62,1.35]%. The less certain selected answer agreed with the key. Its Brier loss is 0.4418, compared with KEV’s 1.71911678. The models’ internal reasons are not observed from these vectors.
Compare different measurements
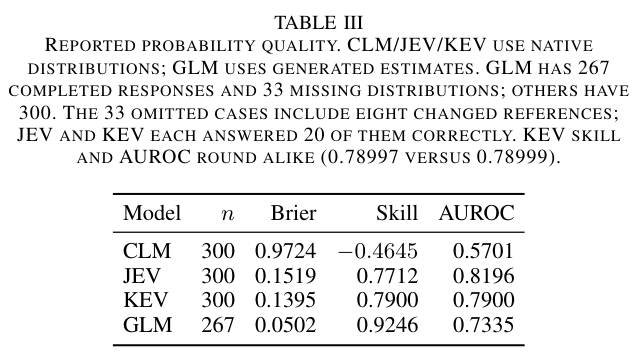
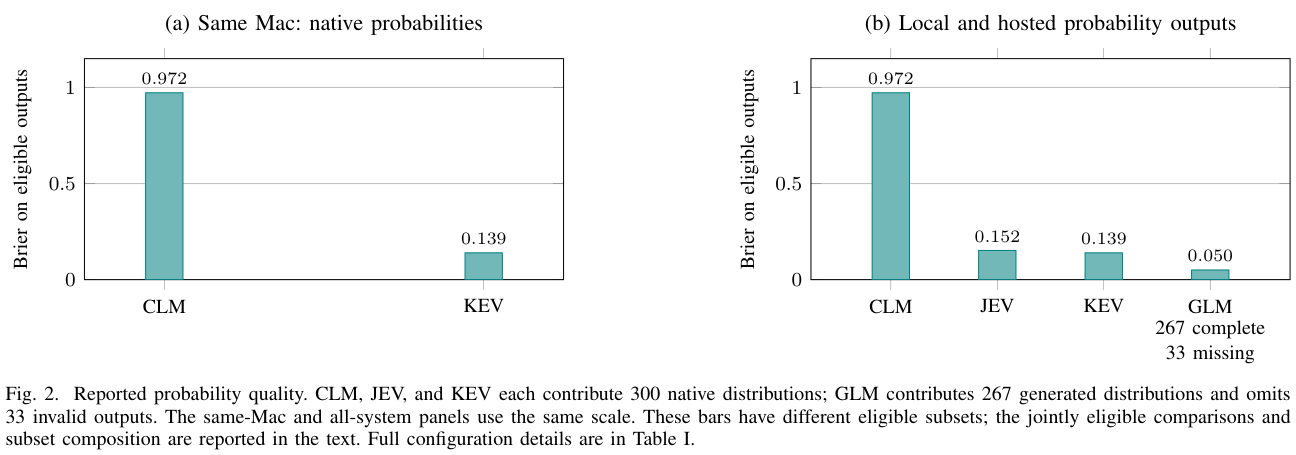
On 300 distributions, JEV’s mean Brier score was 0.1519 and KEV’s 0.1395. KEV had the lower loss; JEV had higher correctness AUROC (0.8196 versus 0.7900). Their skill scores were 0.7712 and 0.7900. A ranking metric and a full-vector loss need not favor the same system.
GLM’s Brier 0.0502 and skill 0.9246 use only its 267 valid distributions. The excluded 33 contain eight changed-reference cases; JEV and KEV each answered 20 of those 33 correctly. The completed subset is therefore consequential. Its AUROC 0.7335 uses only seven incorrect valid decisions.
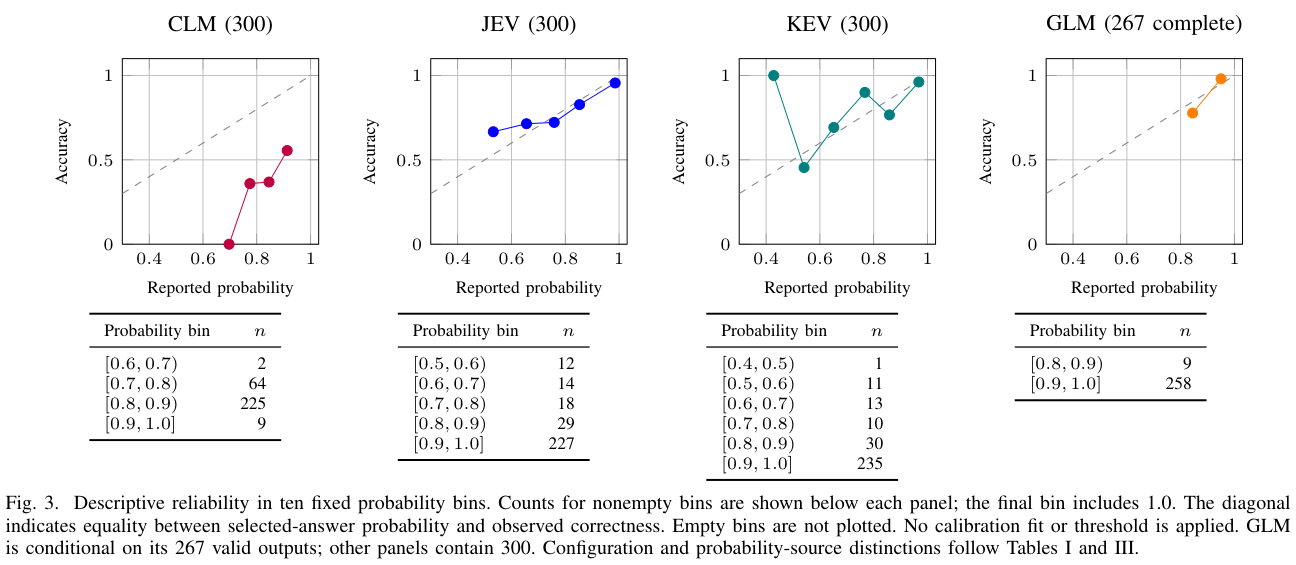
Figure 2 shows probability quality, not error-consequence counts. Figure 3 compares certainty with correctness in ten fixed bins. The paper includes bin counts, but these counts alone cannot reconstruct each plotted mean. Read the original plotted evidence with its stated eligibility.
Go deeper: precision and selected subsets
JEV's values lie on a two-decimal grid; KEV reports three positive entries on each case. This does not establish a causal explanation for model behavior. KEV skill 0.78997 and AUROC 0.78999 merely round alike. The AUROC ordering reverses on the post-hoc unchanged-reference subset, so that sensitivity check cannot replace the full-bank comparison. Jointly eligible GLM comparisons retain the same 267 IDs; they do not restore missing distributions.
Read the original visual evidence
Read Table III and Figure 3 counts as text
Table III lists eligible n, Brier, skill and correctness AUROC. CLM: 300, 0.9724, −0.4645, 0.5701. JEV: 300, 0.1519, 0.7712, 0.8196. KEV: 300, 0.1395, 0.7900, 0.7900. GLM: 267, 0.0502, 0.9246, 0.7335. Negative CLM skill means worse loss than the fixed baseline.
Figure 3 has ten fixed probability bins. A bin [0.6,0.7) includes 0.6 and excludes 0.7; the final [0.9,1.0] includes 1.0. CLM nonempty bin counts: 0.6–0.7: 2; 0.7–0.8: 64; 0.8–0.9: 225; 0.9–1.0: 9. JEV: 0.5–0.6: 12; 0.6–0.7: 14; 0.7–0.8: 18; 0.8–0.9: 29; 0.9–1.0: 227. KEV: 0.4–0.5: 1; 0.5–0.6: 11; 0.6–0.7: 13; 0.7–0.8: 10; 0.8–0.9: 30; 0.9–1.0: 235. GLM: 0.8–0.9: 9; 0.9–1.0: 258. Empty bins have no plotted point; no calibration fit or threshold was applied. Exact point coordinates are not printed in the paper and cannot be reconstructed from these counts.
Go deeper: precision and the unchanged-reference subset
Median chosen-answer probabilities were JEV 99.00% and KEV 96.70%. JEV returned 123 one-hot vectors, 172 with two positive entries and five with three; its one-hot errors were C090 and C298. Accepted nonexact sums occurred in 285 CLM, zero JEV, 75 KEV and zero GLM responses; scoring did not normalize them. On the post-hoc 289 unchanged references, JEV had 270 correct, Brier 0.0997 and AUROC 0.9094; KEV had 273 correct, Brier 0.0810 and AUROC 0.9367. The eleven changed cases contributed 36.8% and 44.0% of their full-bank Brier loss respectively. Removing cases changes AUROC comparison pairs, so this does not identify an additive or causal explanation.