Reference material
Figures and tables from the paper
Start the guided walkthrough →
Original manuscript images
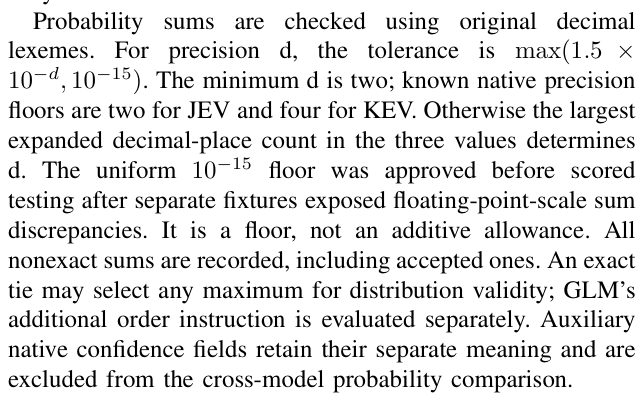
These images preserve the figures, tables, and tolerance formula from the source PDF. They are not newly fitted plots. Select an image to open its full-resolution PNG. The original paper remains available for layout, surrounding text, and exact attribution.
Figure 1 · Primary accuracy and HTTP timing
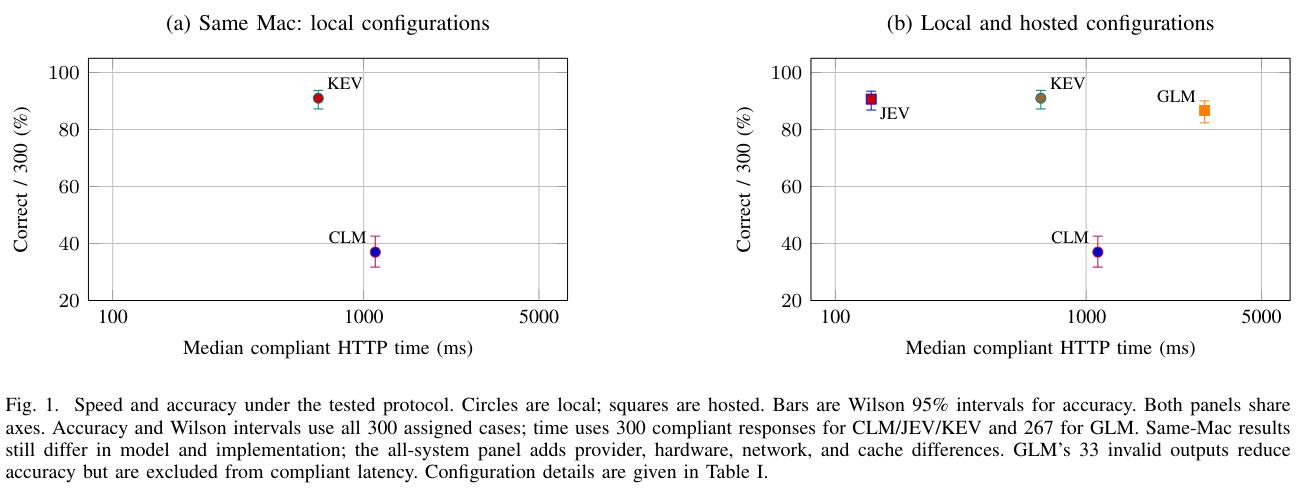
Figure 2 · Reported probability quality
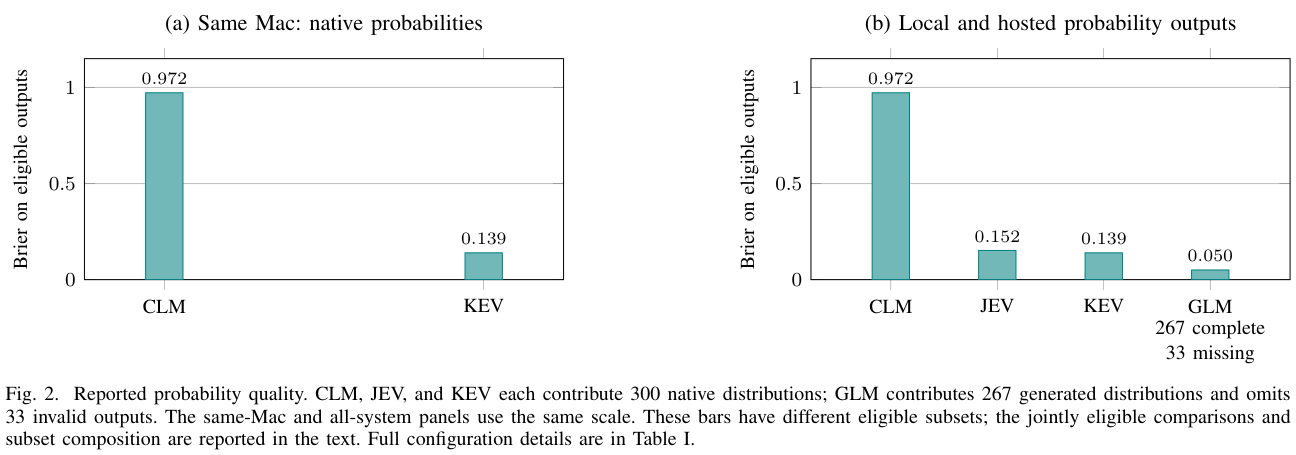
Figure 3 · Reliability diagrams
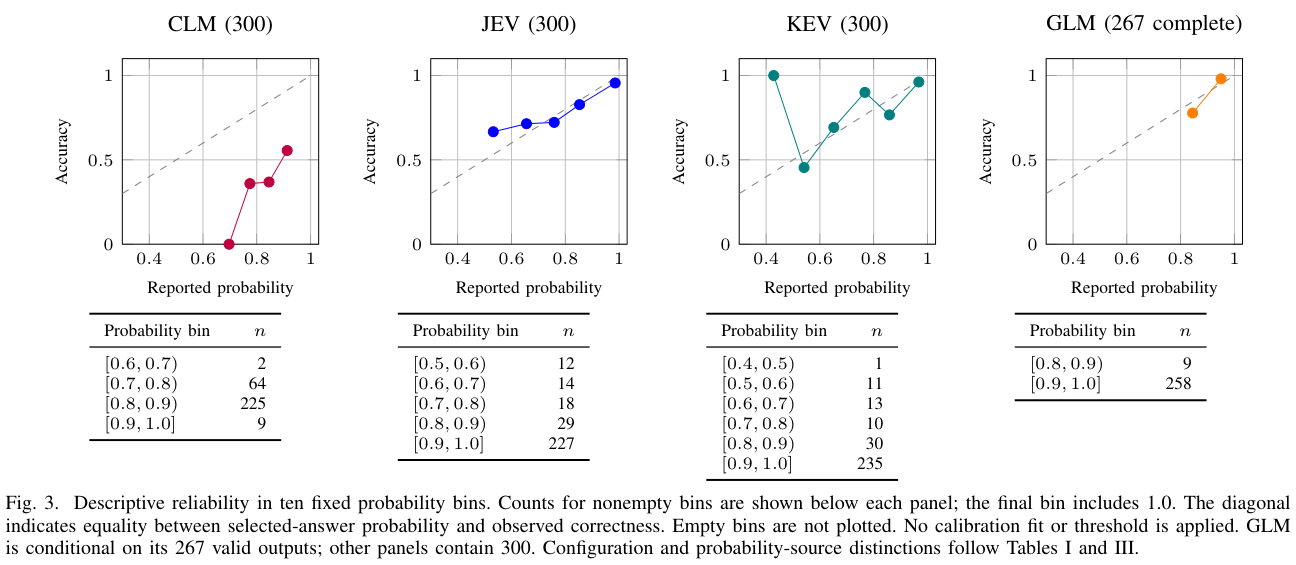
Table I · Accuracy and timing
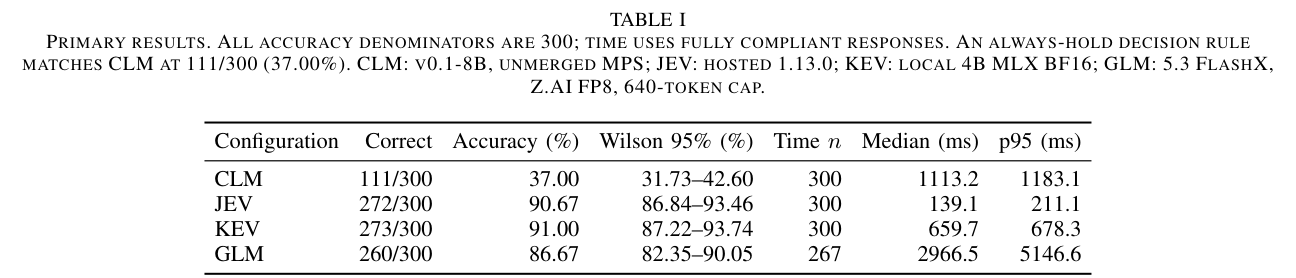
Table II · Decision agreement
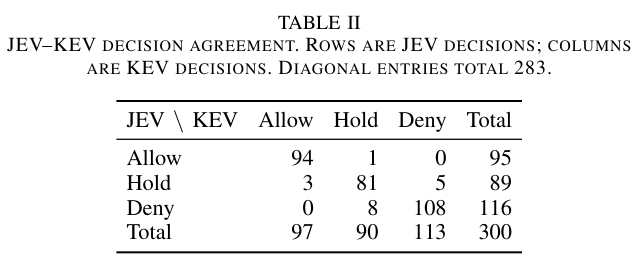
Table III · Probability quality
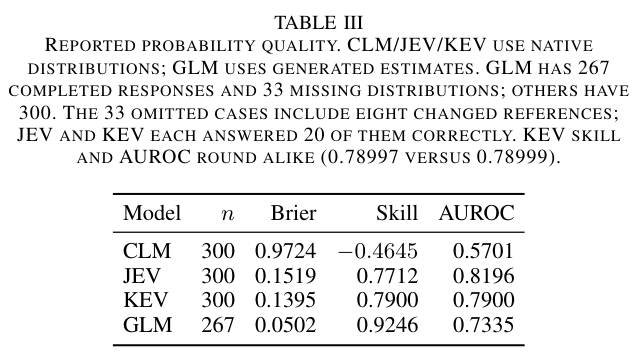
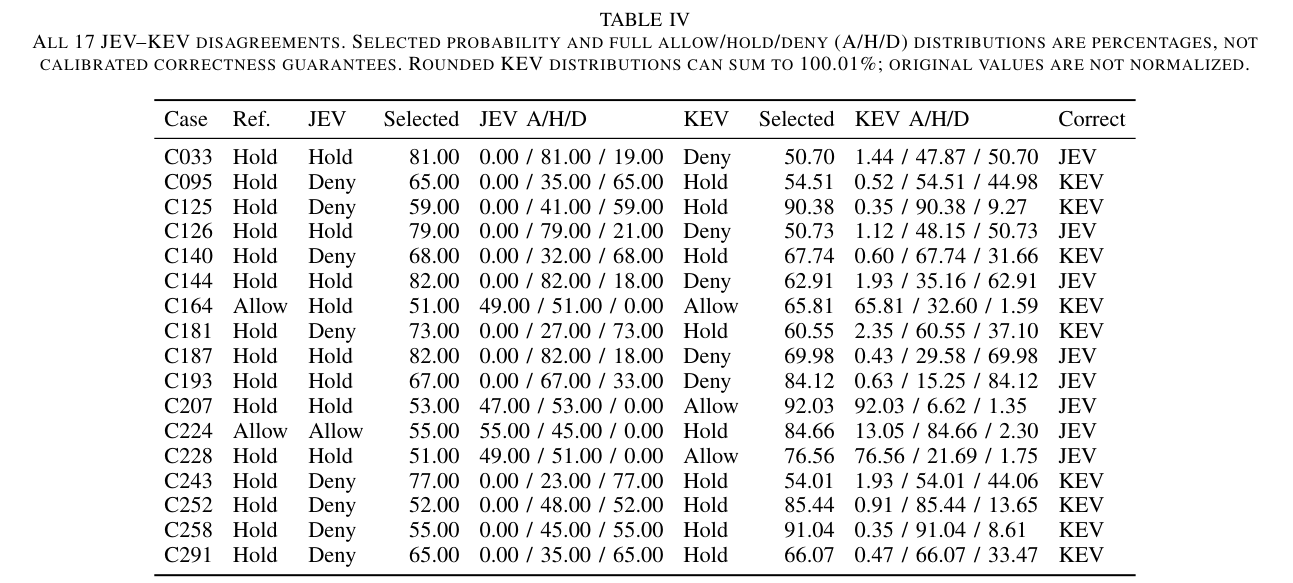
Table IV · Disagreements
Original probability tolerance