# Read the accuracy results
> Explain why coverage and class-level results matter beside accuracy.
[Canonical HTML page](https://trustcyber.ca/research/allow-hold-deny/lessons/12-accuracy-results/)
- Author: Junior Williams
- Type: Research companion addition
## Learning objective
Explain why coverage and class-level results matter beside accuracy.
- [Original paper: §V.A–B; Table I; Figure 1 · page 4](https://trustcyber.ca/research/allow-hold-deny/original.pdf#page=4)
Source pages: 4, 5
## Read counts before rounded percentages
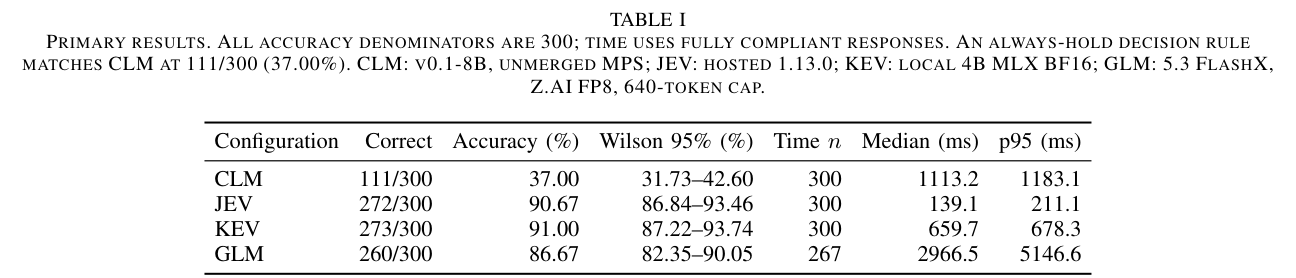
Every primary score uses the same denominator: 300 assigned cases.
- KEV: 273 correct, or 91.00%.
- JEV: 272 correct, or 90.67%.
- GLM: 260 correct, or 86.67%.
- CLM: 111 correct, or 37.00%.
CLM, JEV and KEV supplied 300 valid responses. GLM supplied 267, leaving 33 invalid. Its valid-only accuracy is 260/267 = 97.38%, but coverage is 89.00%.
## Inspect the two failure patterns
CLM selected Hold on every case. It matched all 111 Hold references and missed the 89 Allow and 100 Deny references. Its decisions match an always-Hold baseline. The study cannot identify whether task representation, model scoring, implementation or their interaction caused that pattern.
GLM's missing answers ended at the completion limit. Those responses are neither valid Hold answers nor transport timeouts. Their omission is uneven across reference classes and selected difficult-looking subsets. High accuracy on completed answers needs to be read together with failed completion.
The matrix explorer includes GLM's separately derived matrix from deposited observations. That full matrix was not printed in the manuscript. Keep this companion derivation distinct from Table II, which compares JEV answers with KEV answers rather than either model with the key.
Go deeper: reading Figure 1
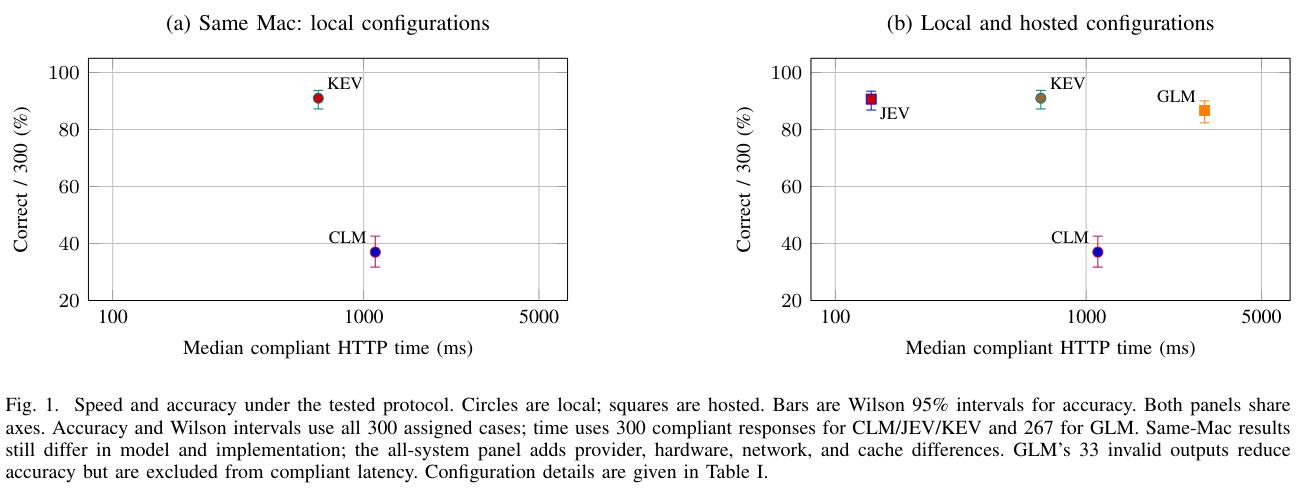
Accuracy bars are Wilson 95% intervals over all 300 assigned cases. The horizontal coordinate is compliant-response median HTTP time. Circles are local and squares hosted. Shared axes support reading the plot, but the experiment does not isolate model-compute speed. Table I includes accuracy, intervals and compliant-response timing counts.
## Read the original visual evidence
Figure 1 · Speed and accuracy. All 300 assigned cases determine accuracy; compliant-response timings use 300 native responses and 267 GLM responses. Select the image for full resolution.Table I · Primary results. Accuracy, compliant-response counts, Wilson intervals and timing for the four tested configurations. Select the image for full resolution.Read Table I as text
CLM: 111/300 correct, 37.00%; Wilson 31.73–42.60%; 300 timed compliant responses; median 1113.2 ms, p95 1183.1 ms.
JEV: 272/300 correct, 90.67%; Wilson 86.84–93.46%; 300 timed compliant responses; median 139.1 ms, p95 211.1 ms.
KEV: 273/300 correct, 91.00%; Wilson 87.22–93.74%; 300 timed compliant responses; median 659.7 ms, p95 678.3 ms.
GLM: 260/300 correct, 86.67%; Wilson 82.35–90.05%; 267 timed compliant responses; median 2966.5 ms, p95 5146.6 ms.
## Browser teaching tools
The canonical HTML page provides interactive controls. Its chapter explains their evidence, arithmetic, and limitations.
- [accuracy](https://trustcyber.ca/research/allow-hold-deny/lessons/12-accuracy-results/#explore-accuracy): Select GLM and change the denominator to valid responses. Compare 97.38% conditional accuracy with 89% coverage.
- [matrix](https://trustcyber.ca/research/allow-hold-deny/lessons/12-accuracy-results/#explore-matrix): Select GLM. Trace correct cells on the diagonal and keep the invalid column in each reference-row total.
## Interactive activities
Use the canonical HTML page for controls, live results and reset buttons.
## Check your understanding (optional)
Why must GLM 97.38% be accompanied by coverage?
- It excludes 33 assigned cases with no valid answer: Correct. The primary denominator retains those failures.
- It uses a different frozen key: The reference key remained the same.
- It proves deployment superiority: The paper does not establish a general winner or deployment safety.
## Take this forward
Next, unpack how one net correct case can conceal many different decisions.
## Reference material
- [results](https://trustcyber.ca/research/allow-hold-deny/results/index.md)
- [figures](https://trustcyber.ca/research/allow-hold-deny/figures/index.md)
## Lesson navigation
- [Previous: How the experiment was run](https://trustcyber.ca/research/allow-hold-deny/lessons/11-experimental-design/index.md)
- [Next: Agreement can hide shared errors](https://trustcyber.ca/research/allow-hold-deny/lessons/13-paired-comparisons/index.md)
## Companion navigation
- [Overview](https://trustcyber.ca/research/allow-hold-deny/index.md)
- [Both authorization studies](https://trustcyber.ca/research/authorization/index.md)